UBS
Intro
Description
Act as if you were a US large cap long portfolio manager and needed to build a systematic long only equity stock picking portfolio that performs in all weathers. Use machine learning to help you achieve optimal stock selection with respect to the real-life constraints. Enhanced index strategies are attractive to investors who would like to capture an excess return over a benchmark. The diversified long only portfolio must be equally weighted, fully invested and must contain 50 stocks at any moment of time.
can only pick stocks which are part of the S&P 500 at the day of selection (some stocks can either drop out from the index or enter the index)
Backtest period: January 2007 - December 2016
Benchmark: Equally-Weighted S&P 500 index (ticker SPW Index).
The ONLY available fields for these stocks are open_price, high_price, low_price, close_price, bb_live (adjusted close price)
You can only use the open, high, low, close price data and the volume.
Criteria
The arithmetic mean of Information ratio (50%), Diversification (30%) and Robustness (20%).
Reply to my question
This is correct.
On top of this, you have to be long only (cannot sell short, but this should be obvious from the fact that 50 stocks have a 2% allocation).
About the “at any moment in time”, we of course do not include the initial calibration of your payout (if any) in this at any time. The implicit part is: at any time after your first allocation.
The concept of payout
The payout is a function that defines allocations or weights for your strategy. The reference for a long (buy) position is 1 while the reference for a short (sell) position is -1. If you go above 1 (resp. below -1), it means you are using some leverage. Conversely, if your position is between 0 and 1 (or -1), it means you only have a fraction of a position; 0.4 is 40% of your target position. 0 means you have sold out of a position and that you are flat. In concrete terms, the payout is defined by a “def” block in Python and satisfies a few constraints:
on the input side: The first argument has to be the data to use for computations. For instance, if the payout generates allocations from correlations between assets, the first argument receives a data frame of asset time series. If you only need the data series in which you invest to generate allocations, you can leave that first argument empty (None in python) and it will be automatically filled with the underlying asset.
on the output side: It returns a data frame of allocations where the index are the rebalancing dates and values are the allocations to implement
Allocation only changes at rebalancing dates. What it means on the example above is that between 16 Dec 2010 and 31 Aug 2011, there is a long position of 1. If you want to exist position, you need to explicitly allocate 0 in your payout at the date at which you want to exit.
Define
Volatility,
Approach 1
The idea is to select the most dissimilar 50 stocks for diversification purposes. We first use the PCA algorithm to find 5 statistical factors and each stock’s exposures to these factors. Then we perform a K-means clustering to find 50 centers to cluster all stocks in 50 groups. Finally, we select the stock closest to the center for each group by computing Euclidean distance. The idea is from the paper A Semiparametric Graphical Modelling Approach for Large-Scale Equity Selection
Approach2
constructs stable portfolios using metrics such as correlation, covariance, Sharpe ratio and volatility. Also creates related visualizations that help select stable portfolios.
Approach3
Deep reinforcement learning policies can be applied for portfolio selection methods. I have performed an experiment for obtaining a portfolio of stocks that will give maximum returns.
Some stocks and their basic OHLC data will form your dataset. This data for the various stocks can be picked up from any particular index which covers a good mix of stocks like Sensex, Nifty etc. The stock portfolio should be created in such a way that it has a mix of low beta value stocks as well as high beta value stocks.
Clustering would be a good option to obtain the different low beta and high beta valued stocks. Once the different clusters are obtained, try to create different combinations of the stocks using permutations and combinations. After the stock selection is done, apply the deep policy network reinforcement learning algorithm on each of those combinations.
Approach4
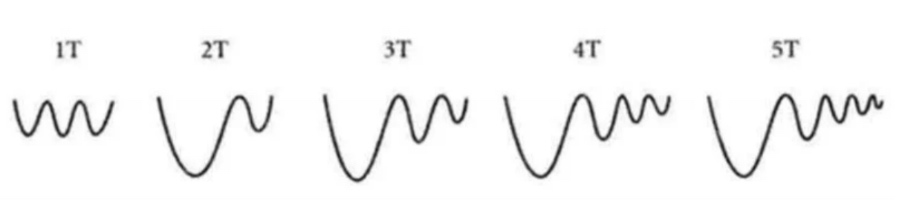
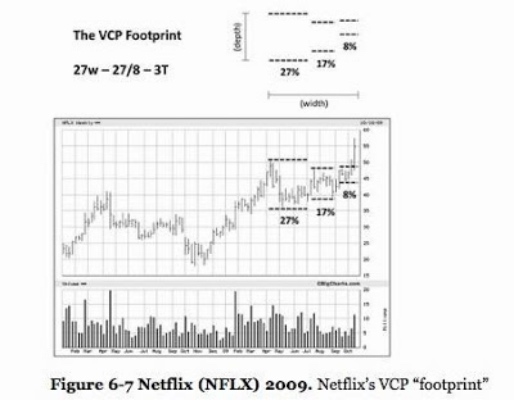
Volatility Contraction Pattern (VCP)
Trade Like A Stock Market Wizard
https://fintastic.trading/investment_strategy/volatility-contraction-pattern-vcp/
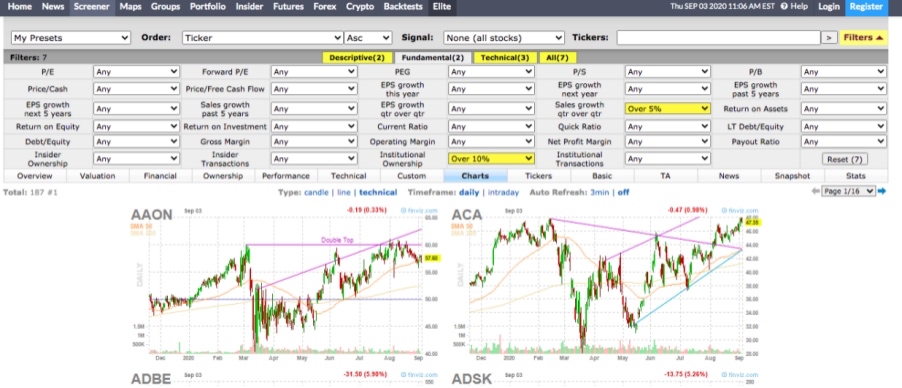
透過Finviz.com網站篩選
如果要手工尋找VCP型態的股票,實在曠日廢時,好在網路上有一些好用的美股篩選(Screener)例如Finviz.com。點選Screener功能,設定以下三項:
- Pattern為Wedge Up 或是 Triangle Ascending
- Price above 200sma
- Average Volume over 500K
就會出現許多”類似”VCP型態的股票技術線圖,從這裡再逐一人工檢查即可
Detail step:
- Screener > Technical
- Setting
- Price above SMA50 (7533>5268)
- 符合「當時股價高於五十天移動平均線」
- SMA200 below SMA50 (i.e. SMA50> SMA200) (5268>3623)
- 符合「五十天移動平均線同時高於一百五十天與兩百天移動平均線」一半
- limitation of Fizviz.com (no SMA150)
- 0-10% below High (3623>2336)
- 符合「目前股價距離五十二週高點不超過25%(愈接近愈好)」 suggest <15%
- limitation of Fizviz.com (0-3%/ 0-5%/ 1-10% for selection)
- Price above SMA50 (7533>5268)
Extra Setting:
Descriptive >
- Market Cap: +Small (over $3 mln) (2336>816)
- Current Volumn: Over 50K (816>790)
- Price: Over $20 (790>626)
Fundamental >
- Sales growth qtr over qtr: Over 5% (626 >216)
- Institutional Ownership: Over 10% (216>187)
- X當時股價高於一百五十天(三十週)與兩百天(四十週)移動平均
- X 一百五十天移動平均高於兩百天移動平均。
- X兩百天移動平均至少有一個月期間處於上升狀態(多數情況最好有四、五個月以上)
- 付費網站都冇
- X五十天移動平均同時高於一百五十天與兩百天移動平均。
- V當時股價高於五十天移動平均。
- V當時股價較五十二週低點至少高出30%(很多最佳候選股在突破橫向整理而展開大規模漲勢之前,股價已經較五十二週低點高出100%-300%或更多。)
- V目前股價距離五十二週高點不超過25%(愈接近愈好)。
- X相對強度評等(relative strength ranking),根據《投資人日報》不低於70,最好是80多或90多,而且較佳候選股總是如此。
Watch List:
佳兆業美好(02168) 希望教育(01765) 保利物業(06049)
技術分析VCP注意事項
- 利用VCP形態選股,股票要在第2階段才有效
- 第2階段指的是上升中的股票
- 股價並不低於30週及40週平均線,而30週線要比40週線高
- 成交量要有一定程度的減少,一波比一波少成交,調整的時間愈來愈少
- 根據Mark Minervini 的說法,盈利成長配合股價的強勢,更容易令股價節節上升
Ref
http://www.lib4dev.in/info/firmai/financial-machine-learning/177023075
Modelling
ML: Supervised & Unsupervised
||
DL: DNN & CNN & RNN
||
DL: LSTM & LSTM + Attention & Transformer & BERT & GPT-3